Air Care Series: Pressure-Volume Loop and Impella Support
/History of Present Illness:
The patient is a male in his 60s with a past medical history of hypertension, hyperlipidemia, ischemic cardiomyopathy, and heart failure with reduced ejection fraction (HFrEF, EF 20-25%) who presented to an outside hospital with chest pain. The patient endorsed substernal chest pain with worsening shortness of breath with no other associated symptoms. At the outside hospital, the patient was found to have dynamic EKG changes and subsequently received 325 mg of aspirin and sublingual nitroglycerin. The patient’s initial troponin and brain natriuretic peptide (BNP) were elevated. He was started on a heparin drip, loaded with ticagrelor and was taken to the cardiac catherization lab. A left heart catheterization showed a 95% stenosis of the proximal left anterior descending (LAD) artery and 70% stenosis of the mid-LAD, and subsequently underwent percutaneous coronary intervention (PCI). His right heart catheterization showed elevated a pulmonary artery pressure of 64/30 mm Hg, an elevated pulmonary artery wedge pressure of 40 mm Hg, and a low cardiac output of 2.4 L/min by Fick method. As such, an Impella percutaneous left ventricular assist device was placed and a helicopter based critical care transport medicine team was called for transport to the nearest tertiary care center with a cardiovascular intensive care unit (CVICU).
Medications
Aspirin 81 mg daily
Atorvastatin 80 mg daily
Torsemide 20 mg daily
Metoprolol XL 12.5 mg dail
Allergies:
None
Past medical history
Hypertension
Hyperlipidemia
Heart failure with reduced ejection fraction
Ischemic cardiomyopathy
Past surgical history
None
Vital signs
HR: 114 BP: 142/76 SpO2: 97% RR: 22 BPM EtCO2: 29
Physical Exam
The patient was tachypneic but in no acute distress. The patient was tachycardic with decreased breath sounds at the bases bilaterally and course breath sounds. The patient had an Impella catheter in the right groin with good hemostasis at the insertion site, and a Swan-Ganz catheter in the right internal jugular vein. The patient had 3+ pitting edema in the bilateral lower extremities with strong pulses in all four extremities.
Imaging
CXR: bilateral pulmonary edema and an enlarged cardiac silhouette
Labs
Troponin: 0.51
BNP: 3408
CBC: WBC 13.2, HgB 12.3 HCT 37.2 PLT182
Renal: Na 139/ K 4.2/ Cl 109/ HCO3 24/ BUN 26/ Cr 1.63
Hospital Course
The patient had an uneventful transport to the CVICU at the tertiary care center. The patient underwent diuresis and was weaned from the Impella on hospital day two without complication. The patient was continued on 81 mg aspirin, and 80 mg atorvastatin. The patient’s diuresis regimen was increased to Torsemide 40 mg daily and the patient was started on 90 mg ticagrelor daily for his stent, 25 mg metoprolol XL and 25 mg losartan daily for his congestive heart failure. It was recommended that the patient be discharged with a LifeVest; however, the patient declined.
Discussion: Cardiogenic Shock, the Pressure-Volume loop, and the physiologic consequence of the Impella
Cardiogenic shock (CS) represents a spectrum of hemodynamic deficits in which the cardiac output is insufficient to provide adequate tissue perfusion. A commonly used definition for CS, adopted by the SHOCK (Should We Emergently Revascularize Occluded Coronaries for Cardiogenic Shock) and IABP-SHOCK II (Intra-aortic Balloon Pump in Cardiogenic Shock II) trials (Table 1), uses the presence of three objective factors: systolic blood pressure of less than 90 mmHg for more than 30 minutes or need for infusion of catecholamines, clinical signs of pulmonary congestion, and impaired end-organ perfusion. [1, 3] While a technical definition is necessary for research, this definition of CS does not capture the continuum of disease observed in a clinical setting. To this end, the Society of Coronary Angiography and Intervention (SCAI) released a definition and classification schema in 2019, which attempts to better classify this continuum and may bridge the gap from bench to bedside (Table 2). [4] The SCAI classification schema acknowledges that patients present at different clinical stages and may benefit from different treatments along the CS continuum. The four classic phenotypes of CS are categorized based on volume status and cardiac output as described in Table 1. For a complete review of CS refer to the previous Taming the SRU Air Care Series article on CS.


Table 1: SCAI Stages of Cardiogenic Shock
JVP = jugular venous pressure; SBP = systolic blood pressure; CVP = central venous pressure; PA = pulmonary artery; MAP = mean arterial pressure; GFR = glomerular filtration rate; LFT = liver function tests; BNP = brain naturitic peptide; BP = blood pressure; PCWP = pulmonary capillary wedge pressure; RAP = right atrial pressuure; PAPI = pulmonary artery pulsitility index; VT = ventricular tachycardia, VF = ventricular fibrillation.
Created by Chuko, J. adapted from: Baran DA, Grines CL, Bailey S, et al. SCAI clinical expert consensus statement on the classification of cardiogenic shock: This document was endorsed by the American College of Cardiology (ACC), the American Heart Association (AHA), the Society of Critical Care Medicine (SCCM), and the Society of Thoracic Surgeons (STS) in April 2019. Catheter Cardiovasc Interv. Jul 2019;94(1):29-37. doi:10.1002/ccd.28329
Pressure Volume Loop:
The fundamentals of cardiogenic shock can be understood through perturbations of a classic concept in cardiovascular physiology: the pressure-volume (PV) loop (Figure 1). The PV loop is a graphical depiction of the cardiac cycle comprised of four distinct phases creating a closed loop.
For Figure 1: (1) Ventricular filling, (2) Isovolumetric Contraction,(3) Ejection,(4) Isovolumetric Relaxation
The four distinct phases of the PV loop are: ventricular filling, isovolumetric contraction, ejection, and isovolumetric relaxation. The transition between each phase is displayed as a point on the PV loop. Point A represents the pressure and volume in the ventricle at the end of diastolic filling, i.e., end diastolic pressure (EDP) and volume (EDV). After isovolumetric contraction (phase 2), point B corresponds to aortic valve opening, when the intraventricular pressure overcomes aortic diastolic pressure. Point C occurs after ejection when the aortic valve closes, representing the end systolic pressure and end systolic volume. Phase four represents isovolumetric relaxation of the left ventricle between point C (aortic valve closure) and point D (mitral valve opening). After mitral valve opening occurs at point D, ventricular filling (phase 1) commences, restarting the cycle.
LV = left ventricle; EDV = end diastolic volume; ESV = end systolic volume; ESPVR = end-systolic pressure-volume relationship; EDPVR = end-diastolic pressure-volume relationship; Vo= volume must fill the ventricle before it can generate any pressure.

Figure 1: Pressure-Volume Loop
The PV loop is bound by the end-systolic pressure-volume relationship (ESPVR) and the end-diastolic pressure-volume relationship (EDPVR). The ESPVR describes the connection between the end systolic pressure and the end systolic volume under the direct influence of ventricular contractility. The ESPVR models the linear (slope EES) relationship between the end systolic pressure (PES) and the end systolic volume (VES) where the X-axis intercept (V0) represents the blood required to fill the ventricle before an increase in pressure is observed. The ESPVR will shift leftwards and upwards with increases in ventricular contractility and rightward and downward with decreases in ventricular contractility with little changes in V0. EES is a load-independent variable of ventricular contractility and changes proportionally with contractility. [5, 6]
The EDPVR is a nonlinear PV relationship which characterizes the passive ventricular properties observed in the relaxation of the ventricle. This is described in the below equation, where constants α and β relate to mechanical properties of the extracellular matrix of the ventricle (where P = pressure; V = volume). Changes to these constants and the EDPVR can be observed in pathological states that change the myocardial matrix. Leftward shifts are observed with a thickened or more resistant myocardium (hypertrophic cardiomyopathy, sarcoidosis, and other infiltrative diseases) while rightward shifts are observed during dilated cardiomyopathy.
P = βVα
Ventricular-vascular coupling is a concept that connects the ventricle to the vasculature ultimately describing how cardiac parameters (stroke volume, mean arterial pressure, etc.) are determined by systemic hemodynamics (preload, afterload, etc.). A line connecting the end diastolic volume (EDV) on the X-axis (volume) to the end-systolic pressure point on the PV loop creates the Ea line. The term Ea is used to describe the slope of this line and is related to the total peripheral resistance (TPR) and heart rate (HR). [6]
Ea = TPR x HR
Myocardial Oxygen Consumption (MVO2):
PV loops can aid in characterizing the determinants of myocardial oxygen consumption. The area within the PV loop is referred to as the SW. SW can be used to determine the cardiac power output (CPO) which is used as an index of severity in CS, and often trended to assess responses to therapies. CPO is inversely correlated with mortality in the setting of CS, with values < 0.6 watts (W) associated with hemodynamic compromise and increased mortality. [27]
CPO = SW x HR
Where SW = stroke volume x mean arterial pressure (MAP)
Clinically, it is more feasible to calculate CPO using cardiac output (CO) and the below equation.
CPO = (CO x MAP) / 451
Myocardial oxygen consumption (MVO2) is linearly related to the pressure volume area (PVA). The PVA is the sum of the SW and the potential energy (PE). PE is the determined by calculating the area bound by ESPVR and the EDPVR at LV volumes below the PV loop (Figure 2A). PE represents the residual energy stored in cardiac myofilaments at the end of systole. To practically estimate the PVA, Saurent et al. employ simple expressions of the PVA to characterize the total MVO2 based on hemodynamic points on the PV loop.
PVA = SW + PE
MW = (ESV-EDV) x (Ppeak – EDP)
PE = 0.5 x ESV x (Ppeak – EDP)
The components of MVO2 are displayed in Figure 2B: basal metabolism, calcium cycling, and mechanical work. It should be noted that as contractility increases, the slope of the PVA line does not steepen. However, the Y-intercept will climb as increased contractility is largely the result of augmentation of calcium cycling. While HR does not have a significant effect on MVO2 per cardiac cycle, it does have a significant effect on MVO2 per minute as small differences between cycles are amplified. [8, 9]
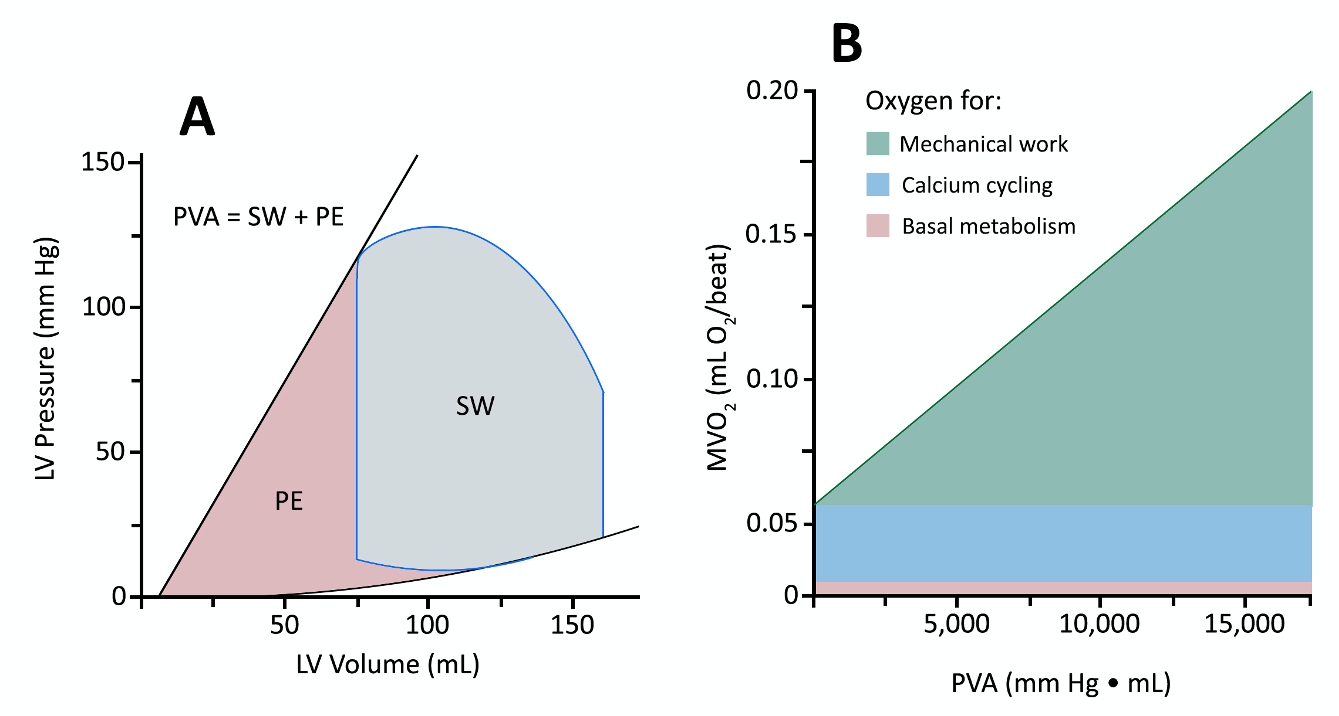
Figure 2: Pressure Volume Area and Myocardial Oxygen Consumption
LV = left vetriccle; PVA = pressure volume area; SW = stroke work; PE = potential energy, Created by Chuko, J. adapted from: Suga H. Ventricular energetics. Physiol Rev. Apr 1990;70(2):247-77. doi:10.1152/physrev.1990.70.2.247
Hemodynamics of Cardiogenic Shock (CS):
The PV loop can aid in characterizing the hemodynamic effects of acutely decreased ventricular contractility in CS (Figure 3). In the initial stages of decompensated CS, most commonly due to acute myocardial infarction (AMI), the ESPVR shifts rightward and downward, while a small elevation is observed in the EDPVR. These changes produce a drop in SW and, subsequently, CPO. Clinically this leads to hypotension, represented by the shrinking height of the PV loop, and cardiac output declines as well.

Figure 3: Pressure Volume Loop of Cardiogenic Shock
LV = left ventricular; LVD = left vetricular distention; NH = neurohormonal, Created by Chuko, J. adapted from: Furer A, Wessler J, Burkhoff D. Hemodynamics of Cardiogenic Shock. Interv Cardiol Clin. 07 2017;6(3):359-371. doi:10.1016/j.iccl.2017.03.006
Compensatory response to CS can also be characterized by the PV loop (Figure 3 C). Neurohormonal activation, the release of catecholamines from the adrenal gland, is the first compensatory response to an acute decrease in ventricular contractility. Total peripheral resistance, HR and contractility increase in response to catecholamines. In addition to the vasoconstriction, venoconstriction also occurs, shifting intravascular volume from high-capacity reservoirs (splanchnic circulation) to low-capacity reservoirs (vena cava and large veins), ultimately increasing central venous circulation (Funk). Collectively, the neurohormonal compensatory effects increase blood pressure but cause a rightward shift of the PV loop through an increase in the end diastolic pressure and volume. It should be noted that the neurohormonal effects on the PV loop can be counteracted by inflammatory changes that occur in shock states (Figure 3D).
Chronically, these compensatory responses lead to ventricular remodeling, producing larger ventricular volumes, characterized by a rightward shift of both the EDPVR and ESPVR, and worsening of LV function. This process persists until it is interrupted by pharmacological or mechanical intervention.
Cardiac Assist Devices:
While the treatment of CS is quite broad, depending on the severity and underlying etiology, the focus of this article is cardiac assist devices – specifically percutaneous ventricular support. Percutaneous ventricular support is most often indicated for classic, deteriorating, and extremis SCAI Stages of CS – CS that is not responsive to optimal medical management and conventional treatment measures. Percutaneous ventricular support devices are an evolving field of mechanical support used in high-risk elective cases and the emergent setting of AMI complicated by CS. The Impella is a contemporary micro-axial flow percutaneous ventricular assist device, which extracts blood from the left ventricle ,through the inlet cage, into the cannula portion of the pump and ejects it into the ascending aorta. [18, 19, 20] The Impella is often used in the emergent setting of AMI to increase coronary and systemic perfusion, reducing end organ failure and breaking the continuum of cardiogenic shock [1, 20, 21] while unloading the left ventricle, reducing myocardial oxygen demand and minimizing the infarct size [22, 20, 26]. The device has a quick deployment process, truncating the duration of CS. (2)
Impella’s Hemodynamic Support:
The hemodynamic support offered by the Impella device is the result of augmented forward flow through the impeller, and pressure augmentation (an increase in aortic and coronary pressure) leading to an increased cardiac power output. The Impella is an active forward flow pump that provides 2.5 to 6.0 L/minute of support. The active forward flow generated by the Impella is dependent on the specific model (2.5, CP, 5.0, LD, RP, 5.5), support level settings (termed “P” level), and the aortic-ventricular pressure gradient (forward flow is increased with a decreased aortic ventricular gradient). The Impella 2.5, at its maximal rotation speed of 51,000 rpm, provides up to 2.5 L/minute of flow, while the Impella CP can provide mean flows of 3-4 L/minute, and the Impella 5.5 provides 6.0 L/min. Valgimigli et al. reported a total net cardiac output increase of 23% associated with Impella 2.5 support while multiple others have reported increased active forward flow. [11, 20, 12] It should be noted that the increased cardiac output is a net increase, accounting for both the Impella forward flow and native cardiac output (Figure 4). Remmelink et al. report augmentation of the aortic blood pressure in addition to the forward flow reported.

Figure 4: Impella’s effect on Cardiac Output
CO = cardiac output

Figure 5: The Impella’s impact on the Pressure-Volume loop
End-systolic pressure-volume relationship = ESPVR; end-diastolic pressure-volume relationship = EDPVR, Based on:Bastos MB, Burkhoff D, Maly J, et al. Invasive left ventricle pressure-volume analysis: overview and practical clinical implications.Eur Heart J. 03 2020;41(12):1286-1297. doi:10.1093/eurheartj/ehz552
Myocardial protection:
Coronary blood flow is dependent on the pressure gradient within the coronary vessels and the resistance of the vasculature. If the distal (venous) pressure is assumed to be fixed, the coronary blood flow is proportional to the ratio of the aortic pressure and the microvascular resistance. In addition to increasing the aortic pressure, the Impella offloads the left ventricle, reducing the left ventricular volume, left ventricle pressure – specifically the end diastolic volume (EDV) and end diastolic pressure (EDP) – and ultimately the ventricular wall tension. The decrease in ventricular wall tension, estimated using the Law of LaPlace, decreases the microvascular resistance in the coronary circulation, leading to the desired increase in blood flow. Remmelink demonstrated this decrease in microvascular resistance in patients undergoing increasing levels of Impella support. The expected increase in coronary blood flow, as a result of increased aortic pressure and decreased microvascular resistance, has been demonstrated in many different models including through Technetium-99m sestamibi myocardial perfusion imaging by Aqel et al. [14, 13, 15]
Ventricular off-loading is a crucial role of the Impella, as the resulting reduction of the MVO2 protects at risk myocardium from ischemic insults. The ventricular off-loading accomplished by the Impella can be characterized by the PV loop (Figure 5).
After active off-loading by the Impella, the area of the PV loop, and thus the amount of work performed by the myocardium, decreases. In addition to the decrease in SW, the Impella may reduce the potential energy (PE) within the myocardium, thus further diminishing MVO2. The PE within the myocardium is directly related to the ventricular wall tension. As previously discussed, the ventricular wall tension is directly related to the EDV and EDP (point A on the PV loop, Figure 4) and PE is the area bound by ESPVR and the EDPVR at LV volumes below the PV loop. The reduction in PE and SW allows the Impella to decrease both determinants of PVA.
A reduction in EDV and EDP increases coronary blood flow and decreases myocardial oxygen demand – impacting both sides of the supply-demand equation.
Safety Profile:
While the Impella provides significant hemodynamic benefit, it is not without complication. The IMPRESS trial demonstrated that both bleeding (33.3%) and hemolysis (8.3%) are frequent complications. [16] A recent systemic review by Hill et al. showed that pooled analysis of prospective CS studies utilizing the Impella had rates of hemolysis of 7.8% (95% CI: 2.3% - 16.2%) and a pooled rate of limb ischemia of 5.9% (95% CI: 0.5% - 16.7%). A pooled analysis of retrospective studies found that complications were relatively infrequent except for bleeding. The pooled analysis of the retrospective studies showed additional risks of: device malfunction 2.5% (1.1%- 4.5%); in-hospital stroke 3.7% (95% CI: 1.8% - 6.2%); limb ischemia 3.6% (95% CI:1.7% - 6.3%); hematoma 4.9% (95% CI:2.3% - 8.3%); hemolysis 8.1% (95% CI: 5.6% - 11.1%); and bleeding 21.4% (95% CI: 15.9% - 27.6%) [29].
IMPRESS RCT: The IMPRESS trial was a randomized, prospective, open-label, multicenter trial, in which 48 patients with severe CS complicating AMI were assigned to percutaneous mechanical support (n = 24) or intra-aortic balloon bump (IABP) (n = 24). Mortality in patients treated with either IABP or percutaneous mechanical support was similar at 30 days (50% and 46%, respectively; hazard ratio: 0.96; 95% confidence interval: 0.42 to 2.18; p = 0.92) and 6 months (50% and 50% hazard ratio: 1.04; 95% confidence interval: 0.47 to 2.32; p = 0.923). [25]
ISAR-SHOCK: The ISAR-SHOCK trial was a prospective, two-center, randomized, open-label study which evaluated whether the Impella 2.5 provides superior hemodynamic improvement compared to IABP for patients suffering CS from an AMI. The Impella 2.5 was found to have a significantly greater increase in cardiac index compared to the IABP at 30 minutes (Impella: ΔCI = 0.49 ± 0.46 L/min/m2; IABP: ΔCI = 0.11 ± 0.31 L/min/m2; P=.02) with unchanged 30-day mortality between the two groups (Seyfarth).
Summary:
Cardiogenic shock (CS) represents a spectrum of hemodynamic deficits in which the cardiac output is insufficient to provide adequate tissue perfusion. The Impella device offers increased cardiac power output, increasing coronary and systemic perfusion, reducing end organ failure and breaking the cycle of cardiogenic shock. Given the favorable safety profile, the Impella’s role in cardiogenic shock is increasing. Critical care transport medicine providers should be familiar with the Impella and comfortable transporting patients supported by this device.
AUTHORED BY Justine Milligan MD,Michael Lauria MD, ADAM GOTTULA MD & Chris Shaw MD
Dr. Milligan (@JustineMilligan) is a PGY-2 Emergency Medicine resident at the University of Cincinnati
Dr. Lauria (@ResusPadawan) is an EMS and Critical Care fellow at the University of New Mexico
Dr. Gottula (@laertezz) is an alumnus of the Class of 2021 University of Cincinnati Emergency Medicine Residency Program. He is now at the University of Michigan completing a fellowship in Critical Care.
Dr. Shaw (@shawkdoc) is an alumnus of the Class of 2021 University of Cincinnati Emergency Medicine Residency Program. He is now at the Oregon Health and Science University completing a fellowship in Critical Care.
Figures By Jon Chuko MD
Dr. Chuko is a PGY-3 Emergency Medicine resident at the University of Cincinnati
FACULTY EDITOR Bill Hinckley MD, SAAD Ahmad MD & Kari Gorder MD
Dr. Hinckley (@UCAirCareDoc) is a an Associate Professor of Emergency medicine as well as Medical Director for Air Care at the University of Cincinnati
Dr. Ahmad (@md_SsAhmad) is an Assistant Professor of Cardiology at the University of Cincinnati with an expertise in interventional & advanced heart failure
Dr. Gorder (@karigorder) is an alumnus of UC EM Class of 2018 and an Attending Critical Care and Emergency Medicine Physician with an expertise in cardiac critical care
References:
Hochman JS, Sleeper LA, Godfrey E, McKinlay SM, Sanborn T, Col J, LeJemtel T. Should we emergently revascularize occluded coronaries for cardiogenic shock: an international randomized trial of emergency PTCA/CABG-trial design. The SHOCK Trial Study Group. Am Heart J 1999;137:313–321.
Samuels LE, Kaufman MS, Thomas MP, et al. Pharmacological criteria for ventricular assist device insertion following postcardiotomy shock: experience with the Abiomed BVS system. J Card Surg. 1999;14:288-293.
Thiele H, Zeymer U, Neumann FJ, et al. Intraaortic balloon support for myocardial infarction with cardiogenic shock. N Engl J Med. 2012 Oct 4;367(14):1287-96.
Baran DA, Grines CL, Bailey S, et al. SCAI clinical expert consensus statement on the classification of cardiogenic shock: This document was endorsed by the American College of Cardiology (ACC), the American Heart Association (AHA), the Society of Critical Care Medicine (SCCM), and the Society of Thoracic Surgeons (STS) in April 2019. Catheter Cardiovasc Interv. 2019 Jul 1;94(1):29-37.
Burkhoff D, Mirsky I, Suga H. Assessment of systolic and diastolic ventricular properties via pressure-volume analysis: a guide for clinical, translational, and basic researchers. Am J Physiol Heart Circ Physiol. 2005 Aug;289(2):H501-12.
Sagawa K. The end-systolic pressure-volume relation of the ventricle: definition, modifications and clinical use. Circulation. 1981 Jun;63(6):1223-7.
Sunagawa K, Maughan WL, Burkhoff D, Sagawa K. Left ventricular interaction with arterial load studied in isolated canine ventricle. Am J Physiol. 1983 Nov;245(5 Pt 1):H773-80
Suga H. Ventricular energetics. Physiol Rev. 1990 Apr;70(2):247-77.
Furer A, Wessler J, Burkhoff D. Hemodynamics Cardiogenic Shock. Interv Cardiol Clin. 2017 Jul;6(3):359-371
Burzotta F, Paloscia L, Trani C, et al. Feasibility and long-term safety of elective Impella-assisted high-risk percutaneous coronary intervention: a pilot two-centre study. J Cardiovasc Med. 2008;9:1004-1010.
Valgimigli M, Steendijk P, Sianos G, et al. Left ventricular unloading and concomitant total cardiac output increase by the use of percutaneous Impella Recover LP 2.5 assist device during high-risk coronary intervention. Cathet Cardiovasc Interv. 2005;65:263-267.
Dixon SR, Henriques JPS, Mauri L, et al. A prospective feasibility trial investigating the use of the Impella 2.5 system in patients undergoing high-risk percutaneous coronary intervention (The PROTECT I Trial): initial US experience. J Am Coll Cardiol Interv. 2009;2:91-96.
Remmelink M, Sjauw KD, Henriques JP, et al. Effects of left ventricular unloading by Impella Recover LP2.5 on coronary hemodynamics. Cathet Cardiovasc Interv. 2007;70:532-537.
Aqel RA, Hage FG, Iskandrian AE. Improvement of myocardial perfusion with a percutaneously inserted left ventricular assist device [published online ahead of print August 15, 2009]. J Nucl Cardiol.
Sauren LD, Accord RE, Hamzeh K, et al. Combined Impella and intra-aortic balloon pump support to improve both ventricular unloading and coronary blood flow for myocardial recovery: an experimental study. Artif Organs. 2007;31:839-842.
Ouweneel DM, Eriksen E, Sjauw KD, et al. Percutaneous Mechanical Circulatory Support Versus Intra-Aortic Balloon Pump in Cardiogenic Shock After Acute Myocardial Infarction. J Am Coll Cardiol. 69(3): 278-287 (2017).
Seyfarth M, Sibbing D, Bauer I, et al. A randomized clinical trial to evaluate the safety and efficacy of a percutaneous left ventricular assist device versus intra-aortic balloon pumping for treatment of cardiogenic shock caused by myocardial infarction. J Am Coll Cardiol 2008;52:1584
Werdan K, Gielen S, Ebelt H, Hochman JS. Mechanical circulatory support in cardiogenic shock. Eur Heart J 2014;35:156–67.
Abiomed, Inc. Impella ventricular support systems for use during cardiogenic shock. Impella 2.5, 5.0, LD and Impella CP instructions for use and clinical reference manual. Danvers, MA: Abiomed; 2016.
Burzotta F, Trani C, Doshi SN, et al. Impella ventricular support in clinical practice: collaborative viewpoint from a European expert user group. Int J Cardiol 2015;201:684–91.
Kapur NK, Esposito M. Hemodynamic support with percutaneous devices in patients with heart failure. Heart Fail Clin. 2015;11:215–30.
Rihal CS, Naidu SS, Givertz MM, et al. 2015 SCAI/ACC/HFSA/STS clinical expert consensus statement on the use of percutaneous mechanical circulatory support devices in cardiovascular care (endorsed by the American Heart Association, the Cardiological Society of India, and Sociedad Latino Americana de Cardiologia Intervencion; affirmation of value by the Canadian Association of Interventional Cardiology-Association Canadienne de Cardiologie d’intervention). Catheter Cardiovasc Interv 2015;85:E175–96.
Allender JE, Reed BN, Foster J et al. Pharmacologic considerations in the management of patients receiving left ventricular percutaneous mechanical circulatory support. Pharmacotherapy 2017;37:1272-83.
Abiomed, Inc. Impella ventricular support systems for use during cardiogenic shock. Impella 2.5, 5.0, LD and Impella CP instructions for use and clinical reference manual. Danvers, MA: Abiomed; 2016
Ouweneel, DM, Eriksen, E, Sjauw, KD, van Dongen, IM, Hirsch, A, Packer, EJ, Vis, MM, Wykrzykowska, JJ, Koch, KT, Baan, J, de Winter, RJ, Piek, JJ, Lagrand, WK, de Mol, BA, Tijssen, JG, Henriques, JP. Percutaneous mechanical circulatory support versus intra-aortic balloon pump in cardiogenic shock after acute myocardial infarction. J Am Coll Cardiol. 2017;69:278–287. doi: 10.1016/j.jacc.2016.10.022 Crossref. PubMed.
Seyfarth, M., Sibbing, D., Bauer, I., Fröhlich, G., Bott-Flügel, L., Byrne, R., Dirschinger, J., Kastrati, A., & Schömig, A. (2008). A randomized clinical trial to evaluate the safety and efficacy of a percutaneous left ventricular assist device versus intra-aortic balloon pumping for treatment of Cardiogenic shock caused by myocardial infarction. Journal of the American College of Cardiology, 52(19), 1584-1588. https://doi.org/10.1016/j.jacc.2008.05.065
Fincke, R., et al. “Cardiac Power Is the Strongest Hemodynamic Correlate of Mortality in Cardiogenic Shock: A Report from the Shock Trial Registry.” ACC Current Journal Review, vol. 13, no. 11, Nov. 2004, p. 49, 10.1016/j.accreview.2004.10.045. Accessed 29 Nov. 2020.
Funk, Duane J., et al. “The Role of Venous Return in Critical Illness and Shock—Part I.” Critical Care Medicine, vol. 41, no. 1, Jan. 2013, pp. 255–262, 10.1097/ccm.0b013e3182772ab6. Accessed 29 Nov. 2020.
Hill, Jonathan, et al. “A Systematic Literature Review and Meta-Analysis of Impella Devices Used in Cardiogenic Shock and High Risk Percutaneous Coronary Interventions.” Interventional Cardiology, vol. 11, no. 1, 2019, 10.4172/interventional-cardiology.1000624. Accessed 29 Nov. 2020.