Ultrasound of the Month: Should I Drain That? Lessons on Cardiac Tamponade
/Case Presentation
A 27-year-old female presents to the ED requesting a refill of her albuterol inhaler. She has a history of asthma and hypothyroidism and states that she has been more exhausted than usual, with some wheezing and a cough. She states that she has not been eating, drinking, or sleeping well for the last 2-3 weeks, and over the last week or so developed wheezing and shortness of breath. She attempted to use her inhaler for relief, but it was out of medication. A review of her chart includes several notes from her primary care provider suggesting she is poorly adherent with her levothyroxine.
Vitals signs are as follows: BP 112/73, HR of 68, SpO2 100% on RA, temperature 98.1F, and RR 14. Physical examination reveals a lethargic female who opens her eyes only with prompting, and diffusely diminished breath sounds but no obvious wheezing.
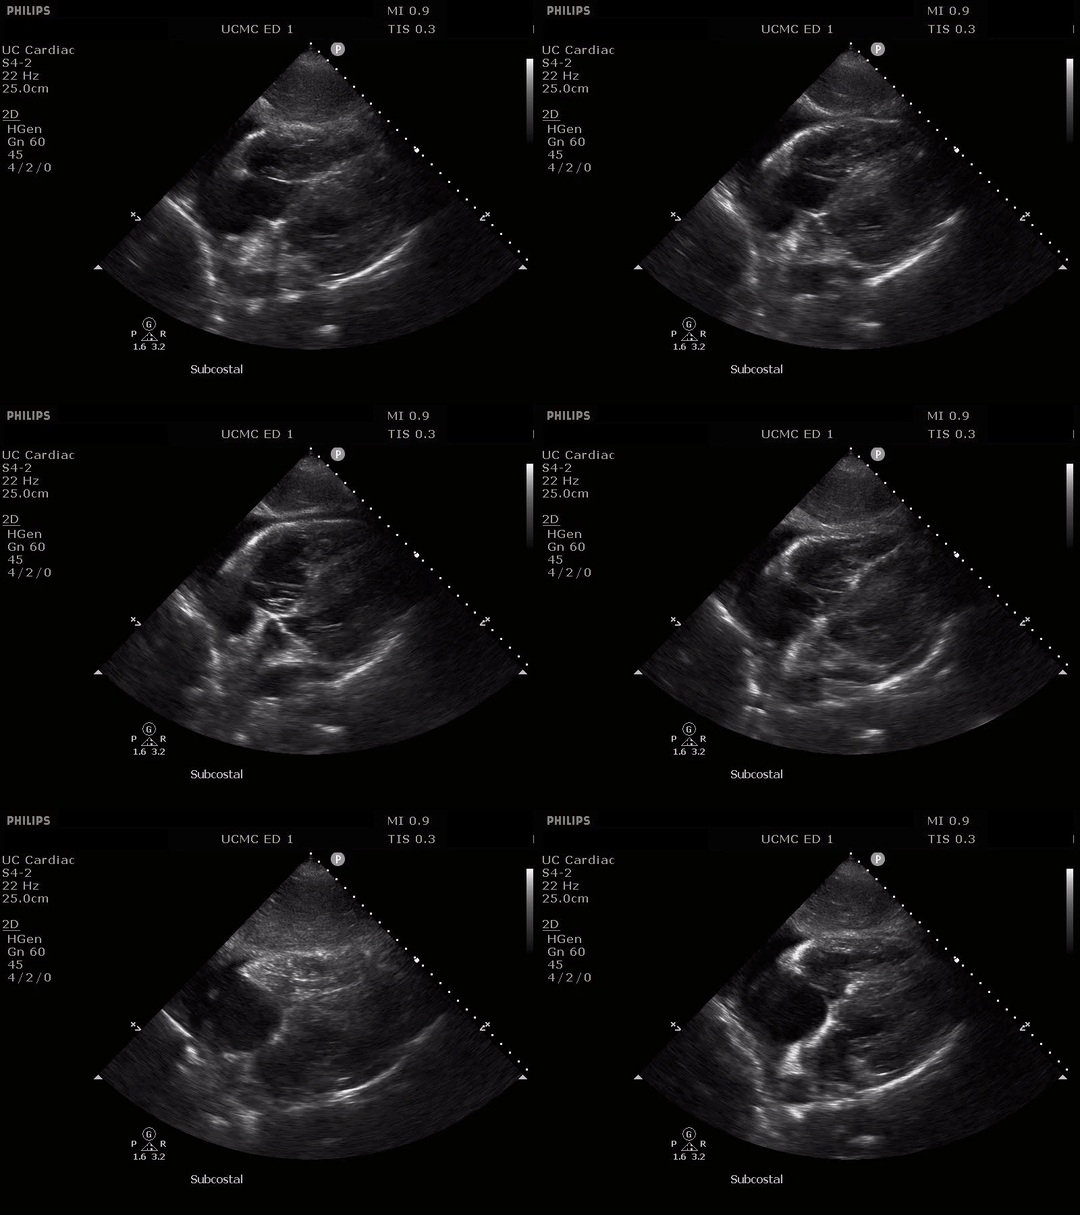
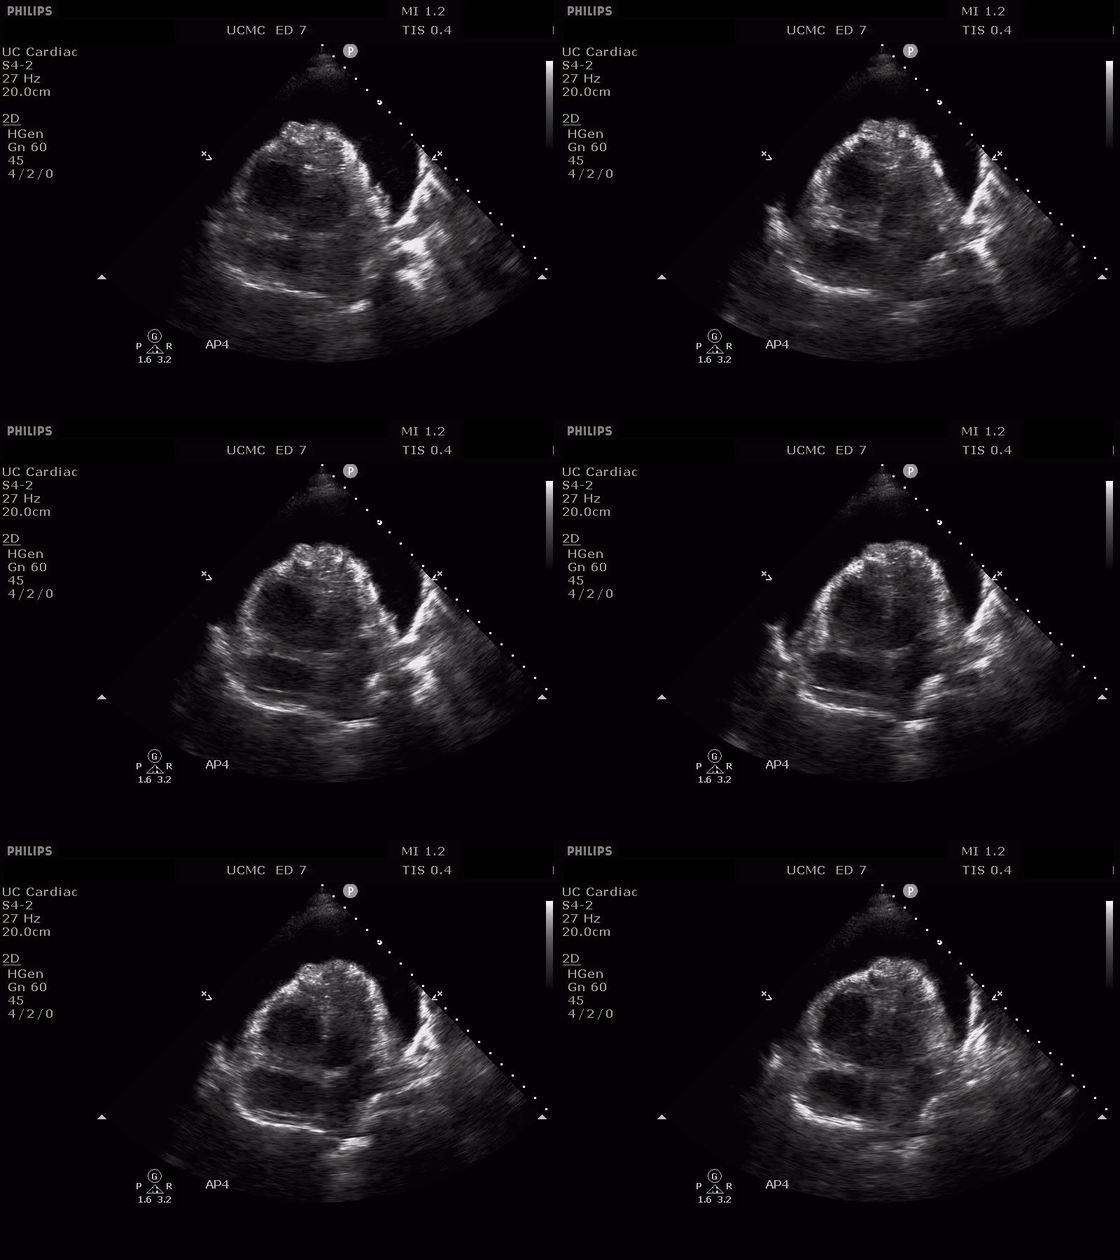
Chest x-ray revealed an enlarged cardiac silhouette. At this point, a bedside echo was performed with findings as below:
Even to the lay eye, it should be obvious that this patient has a moderate to large pericardial effusion. Clinically, the vitals of the patient would suggest a stable patient, but with the images being so concerning, how do you know if this patient has impending clinical tamponade physiology? What images should be obtained to prove or disprove your concerns? What images or key phrases would a cardiologist want to see or hear before intervening with a pericardiocentesis? Let’s take a deeper dive into the literature and review some cases to discuss.
POINT OF CARE ULTRASOUND FOR CARDIAC TAMPONADE
Cardiac tamponade is a very specific physiological condition that occurs not just with the presence of pericardial fluid, but rather when sudden or excessive accumulation of fluid in the pericardium leads to restriction of filling of the cardiac chambers. This decline in preload leads to hypotension, shock, and ultimately cardiac arrest.
The majority of pericardial effusions occur in patients with normal vital signs, and as mentioned above, the size of the effusion alone does not reliably predict hemodynamic compromise or cardiac tamponade. Furthermore, even patients in very early tamponade may compensate for the resultant decreased cardiac filling, leading to falsely reassuring vital signs. For these reasons, it is vital that emergency physicians be able to determine the presence or absence of tamponade physiology on ultrasound.
This question of tamponade or no tamponade can be answered through the use of more comprehensive transthoracic echocardiography (TTE) with 2D images obtained in standard parasternal long and short axis, subcostal, and apical four chamber views, as well as using M-mode and Doppler analysis of blood flow. Bedside echocardiography for pericardial effusions should include a comprehensive evaluation in all 4 standard views. Specifically, the provider should evaluate for size of the effusion, location of the effusion (global vs localized), and signs of cardiac tamponade (1). Echocardiographic findings of cardiac tamponade include:
Diastolic collapse of the right atrium and right ventricle
Excessive respiratory variation of the inflow velocities over the mitral and tricuspid valves
Lack of respiratory variation of the IVC diameter (2).
For a complete review of how to obtain these types of images, please see Dr. Murphy’s post from February of 2018 discussing cardiac tamponade.
Test your knowledge by reviewing the following images to determine which of these patients demonstrates ultrasonographic signs of tamponade.
Example 1
30 year old F:
Initial Presentation
Parasternal Long Axis
30 year old F:
Hospital day 2
Parasternal Long Axis
Example 1 Answers
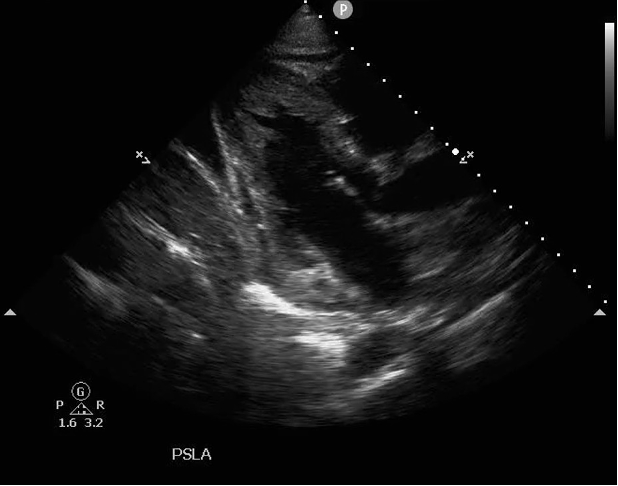
The images in this case series are from the same patient obtained 24 hours apart. “day 2” images demonstrate tamponade physiology, whereas “initial” images demonstrate a moderate pericardial effusion without clinical signs of tamponade physiology. The patient is a middle aged male with history significant for IV drug use and DVT status post IVC filter who presented with altered mental status. He was brought to the resuscitation bay with labored breathing, tachycardia to the 150s, hypoxemia with SpO2 of 75% on RA, and normal blood pressure. When the patient became hypotensive, a bedside TTE revealed the images seen in “initial”.
While the size of the effusion itself is concerning in both patient videos, the most specific finding for diagnosing tamponade physiology is right ventricular collapse during diastole. In one study, RV collapse was 93% sensitive and 100% specific for tamponade, with a PPV of 100% (3). Other studies cite a lower sensitivity and specificity at 48-60% and 75-90% respectively, but still highly specific in evaluating tamponade physiology in the presence of an effusion (4). Deciding if the RV is collapsing during diastole however can be difficult to the novice sonographer. Cardiologists often use real time EKG monitoring to determine if the RV is collapsing during diastole, but frequently the emergency physician does not have this tool in the emergency department. Slowing down the video clip can help distinguish RV collapse during different phases of the cardiac cycle. In the PSLA view, diastole is evidenced by the presence of an open mitral valve, and systole is evidenced by the presence of a closed mitral valve. Collapse of the RV in the presence of diastole (open mitral valve) in the setting of a pericardial effusion is concerning for cardiac tamponade physiology.
While diastolic collapse of the RV is a highly specific finding for tamponade, the earliest and most sensitive sign for tamponade is collapse of the right atrium during systole. A thin walled structure, the RA is highly susceptible to extra-cardiac pressures and usually will demonstrates systolic collapse before RV collapse is vuslized in diastole (2). Again, this is a nonspecific sign that can be seen with other pathologies, but is an early indicator to suggest development of tamponade. Collapse of both atria during systole increases the specificity of tamponade (2).
initial presentation
day 2
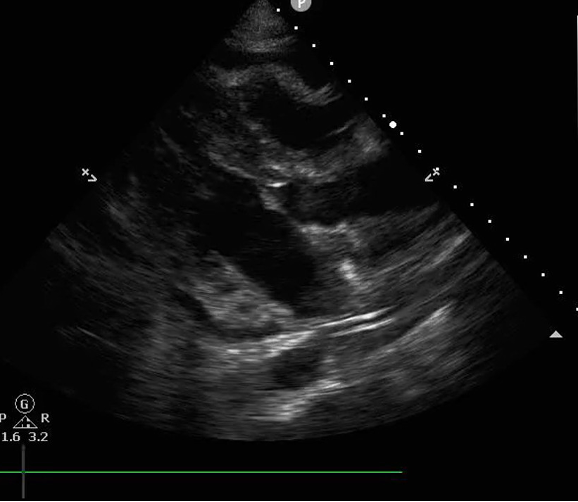
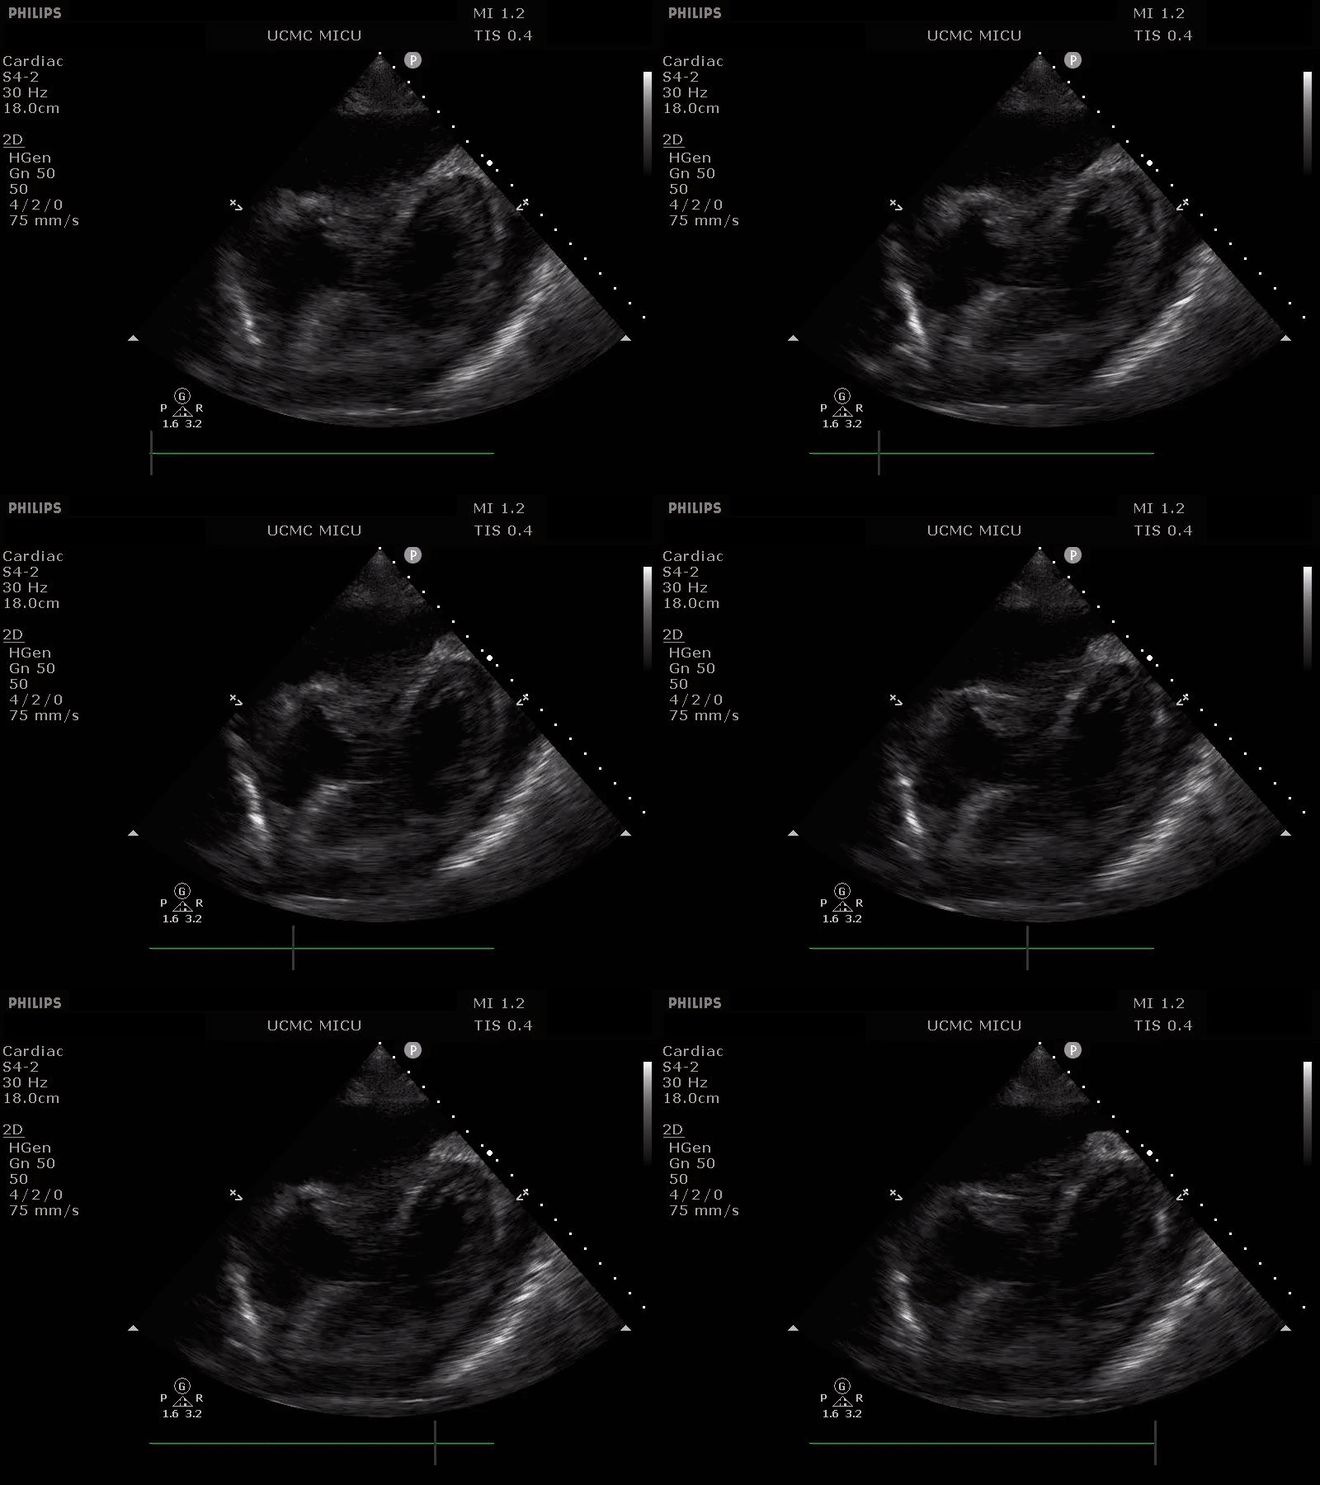
This case series also demonstrates the importance of serial ultrasounds. The patient was admitted to the MICU and had progressive hypotension despite aggressive fluid resuscitation. Repeat assessment four hours after the first scan revealed a larger effusion and development of tamponade physiology as viewed above. With these findings, the patient had a pericardial drain placed by cardiology with return of 500 cc of purulent fluid and resolution of tamponade physiology.
Example 2
Patient 1:
60 year old M
Parasternal Long Axis
Patient 1:
60 year old M
Parasternal short axis
Patient 2:
45 year old M
Parasternal Long Axis
Example 2 Answers
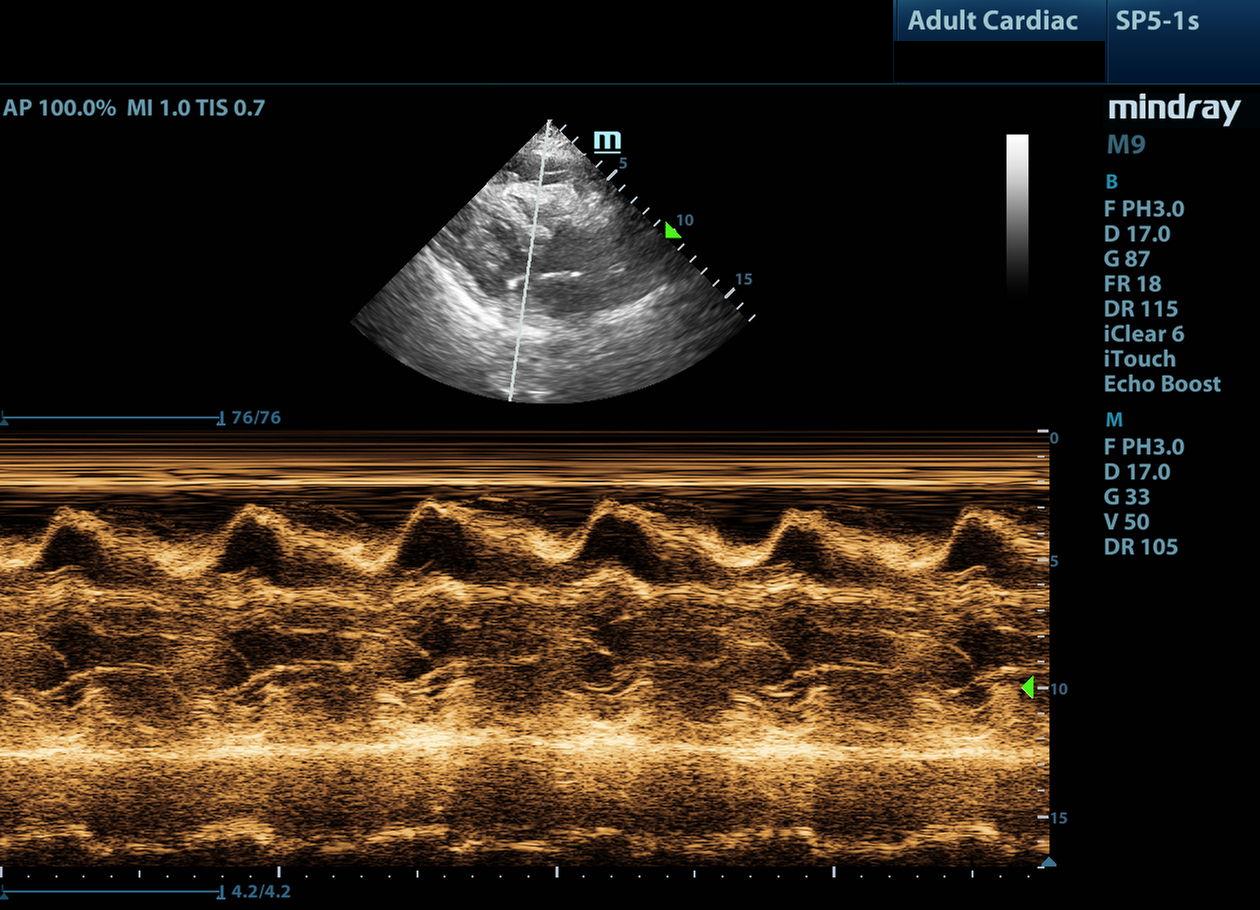
Another way to visualize the collapse of the RV free wall in the cardiac cycle is to use M-mode in the Parasternal Long Axis view to observe the movement of the RV free wall relative to the mitral valve in one dimension over time. M-mode (motion mode) allows the user to view one slice of the ultrasound image as it changes over time. Within this image, the RV free wall can be viewed at the near field (top) of the screen, and the movement of the mitral valve can be traced in the middle of the screen. If the RV free wall collapses at any point in time while the MV is open, then diastolic collapse is present and thus tamponade physiology is present. Additionally, the duration of the RV free wall collapse can be an indicator of severity of tamponade, with longer durations of collapsibility indicating more severe tamponade (4). Below are example pictures from Patient 1 and 2 utilizing this m mode technique.
Patient 1
Patient 2
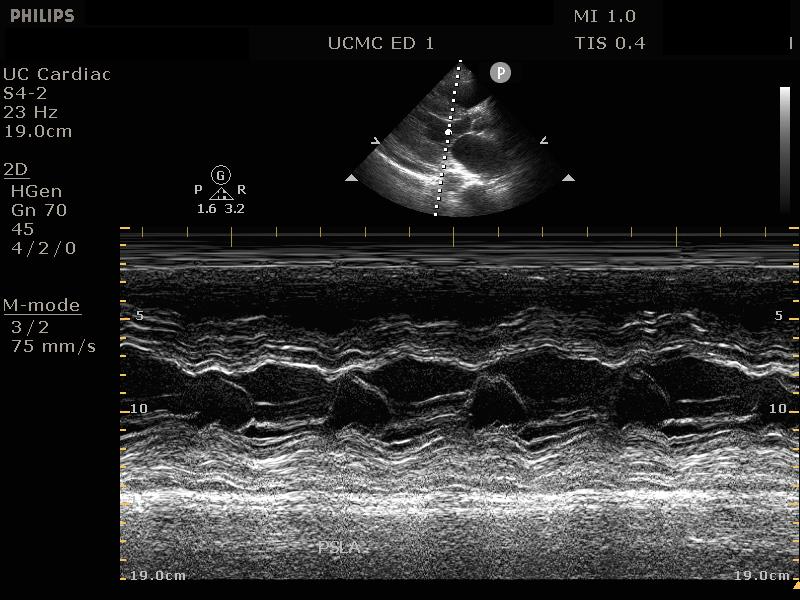
Patient 1 demonstrates collapse of the RV as the mitral valve opens, signifying tamponade physiology. Conversely, Patient 2 demonstrates absence of RV free wall movement when the mitral valve is open, thus signifying the absence of tamponade physiology.
Example 3
Patient 1:
34 year old F
Subcostal 4-chamber
Patient 1:
34 year old F
IVC
Patient 2:
53 year old F
Subcostal 4-chamber
Patient 2:
53 year old F
IVC
Patient 3:
47 year old M
Apical 4-chamber
Patient 3:
47 year old M
Subcostal 4-chamber
Patient 3:
47 year old M
IVC
Example 3 Answers
Answer: Patient 1 does not have tamponade while Patients 2 and 3 do have tamponade physiology.
This case series also illustrates an important sign present in cardiac tamponade – a plethoric IVC. In the video clip of the IVC in Patient 1, the IVC demonstrates respiratory variability and collapses > 50% on inspiration, indicating normal central venous pressure. In the video clip of the IVC in Patient 2, the IVC is plethoric (> 2 cm) but does have some variability with respirations. This indicates elevated right heart pressures, which is a nonspecific finding that is usually present in cardiac tamponade. Finally, in the video clip of the IVC in Patient 3, the IVC is both plethoric AND has almost no respiratory variation, indicating a concern for tamponade physiology in conjunction with the previously discussed findings. One study cited IVC plethora as being 97% sensitive for diagnosing pericardial tamponade, but only 40% specific (5). It is important to note that IVC plethora in isolation does not suggest cardiac tamponade, as a wide variety of cardiopulmonary pathology can cause elevated right heart pressures and demonstrate a plethoric IVC. Given the exam of Patient 2, I would have a very high suspicion of impending tamponade physiology and would likely recommend serial bedside TTE’s to the admitting team to monitor the patient’s condition. However, given the high sensitivity of IVC plethora, the lack of this finding on Patient 1’s imaging essentially rules out tamponade physiology.
CONCLUSION AND CASE FOLLOW UP
There are additional ultrasound modalities beyond the scope of this discussion that can allow for quantitative assessment of tamponade physiology, including mitral valve inflow velocities which are discussed in Dr. Tim Murphy’s post. Additionally, in any individual patient, while the number of echo signs of cardiac tamponade present will increase as the hemodynamic and clinical severity of the pericardial effusions progresses, maintaining an awareness of the most sensitive and specific signs of tamponade will guide your clinical decision making and allow for timely intervention if indicated.
For the initial patient, she was admitted to cardiology service for placement of a pericardial drain, which drained 800 mL of straw-colored fluid. The effusion was thought to be due to hypothyroidism associated with medication non-compliance. The patient was restarted on IV levothyroxine and transitioned to a higher home dose.
Post by Anita Goel, MD
Dr. Goel is an Assistant Professor in the Department of Emergency Medicine at the University of Cincinnati
Peer Review by Jessica Baez, MD
Dr. Baez is an Assistant Professor in the Department of Emergency Medicine and Ultrasound Faculty at the University of Cincinnati
Layout and editing by Arthur Broadstock, MD
Dr. Broadstock is a PGY-3 in Emergency Medicine at the University of Cincinnati and Resident Editor of Ultrasound of the Month.
References
Nagdev, Arun, and Michael B. Stone. “Point-of-Care Ultrasound Evaluation of Pericardial Effusions: Does This Patient Have Cardiac Tamponade?” Resuscitation, vol. 82, no. 6, 2011, pp. 671–673.
Pérez-Casares A, Cesar S, Brunet-Garcia L, Sanchez-de-Toledo J. “Echocardiographic Evaluation of Pericardial Effusion and Cardiac Tamponade”. Frontiers in Pediatrics. 2017;5:79.
Singh, S., et al. “Usefulness of Right Ventricular Diastolic Collapse in Diagnosing Cardiac Tamponade and Comparison to Pulsus Paradoxus.” Journal of Critical Care, vol. 2, no. 2, 1987, p. 148.
Alerhand, Stephen, and Carter, Jeremy M. “What echocardiographic findings suggest a pericardial effusion is causing tamponade?”, The American Journal of Emergency Medicine, vol 37, iss 2, pp. 321-326.
Himelman RB, Kircher B, Rockey DC, Schiller NB. “Inferior vena cava plethora with blunted respiratory response: a sensitive echocardiographic sign of cardiac tamponade.” J Am Coll Cardiol. 1988 Dec;12(6):1470-7.


