Small Kids and Squiggle Lines - An Introduction to Pediatric EKG Interpretation
/It’s a typical shift in your community shop when you see a patient on the board that makes you nervous. 2 year old male with syncope. It’s been awhile since you have treated someone born in the 21st century and you know this child’s workup will likely involve an EKG. The closest pediatric hospital is 2 hours away. How comfortable do you feel interpreting the squiggle lines generated by this little heart?
RATE, RHYTHM, AXIS, INTERVALS, MORPHOLOGY
Rate

Heart rate is the major contributor to cardiac output in children, not stroke volume. For this reason it is essential to use age appropriate heart rate ranges when interpreting EKGs in the pediatric population. (1) Tables of normal ranges can be found in various textbooks and online. Here you can see an example from Tintinalli’s. (2) Of note, these are gathered from healthy children at rest and your patient’s level of irritation and/or fever should be considered. Heart rate can be calculated using the same methods used in the adult population such as large or small box counting. As with adults, rates of irregular rhythms should be calculated by multiplying the number of QRS complexes in the bottom rhythm strip by 6.
Rhythm
Sinus or non-sinus for our purposes. Sinus rhythm requires a P-wave preceding each QRS complex that occurs at a regular interval (just like in adults). A true sinus atrial rhythm will have a P-wave axis between 0 and +90 degrees as described below. Benign sinus arrhythmia is often more pronounced in children due to their thinner myocardium being more sensitive to variations in wall stretch.
Axis

As you recall, the right ventricle does the heavy lifting for the fetus in utero. As a result, the right ventricle is dominant in early life causing a rightward deviation in the QRS axis. As the left ventricle grows the QRS axis normalizes. Again, normal ranges can be found online and in texts with Tintinalli’s shown here. (3)
Calculated axis values for P, R and T are provided on the majority of automated EKG machine interpretations. While these have been shown to be accurate in the measurement of axis (as well as rate and intervals), you should always check these values since arrhythmias and altered intervals can disrupt the algorithm used in the automated readings. QRS axis can be calculated in pediatric EKGs using your preferred method utilized in adult interpretations. Refreshers can be found here.
The atria are less affected by the fetal circulation and have a similar axis seen in adults. The P wave should be upright in leads I and aVF creating an axis between 0 and +90 degrees. A positive P wave in lead I but negative in leads II and aVF may represent an ectopic atrial rhythm.
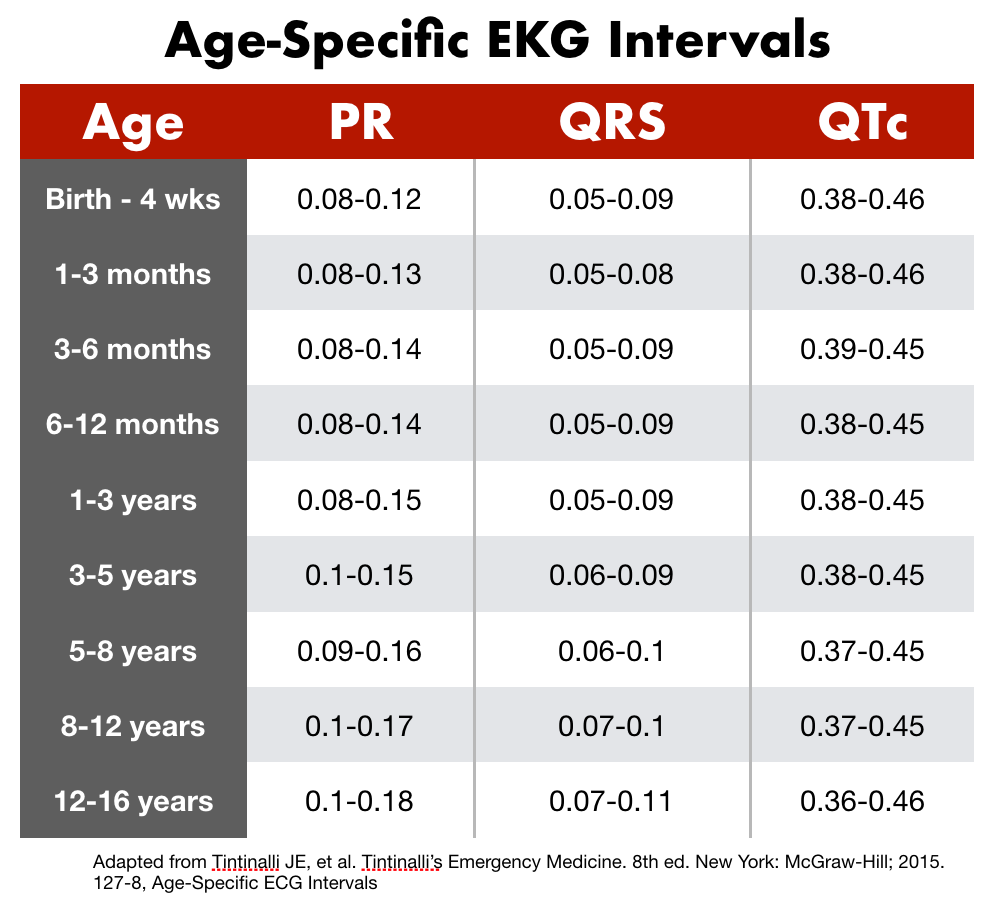
Intervals
The various intervals of an EKG represent conduction time as an electrical depolarization/repolarization moves through the heart. As one would expect, these values are smaller in the pediatric population due to a smaller heart. Again, age appropriate ranges should be referenced when evaluating the PR interval, QRS interval and QTc.
PR Interval - Atrioventricular conduction is assessed with the PR interval. An increased PR interval suggests either a conduction delay or block within the AV node. The classifications of heart block are similar to those for adults (First-Degree, Second-Degree Type I & II, Third-Degree). Additional pathologies which cause PR prolongation include hyperkalemia, digitalis toxicity, myocarditis and atrial septal defects. Shorten PR intervals are present in Wolff-Parkinson-White and the glycogen storage diseases.
QRS Interval - Ventricular depolarization is represented in the QRS complex. Due to the smaller overall size and decreases muscle mass, the QRS is shorter in the pediatric population with normal adult values reached in adolescence usually. Wide or prolonged QRS durations are seen with the bundle branch blocks, Wolff-Parkinson-White, ventricular arrhythmias and intraventricular blocks. (4)
QT Interval - Ventricular repolarization is represented in the QT interval. In addition to being age dependent, the QT interval is also heart rate dependent and thus needs to be corrected for heart rate. This corrected value is known as the QTc. There are numerous methods available with Bazett’s formula being the most commonly used and straight forward. In this formula, one takes a measured QT interval and divides it by the square root of the preceding R-R interval. This should be calculated in seconds.
QTc = QT interval / (√R-R interval)
While time consuming to perform, the QTc should be calculated for each case as the automated algorithms in EKG machines can be inaccurate in the pediatric population. Calculations should be performed using lead II or the lead with the least artifact. (5) (6) Prolonged QTc is seen with electrolyte abnormalities (hypo-Ca, K, or Mg), myocarditis, head injuries, or are drug induced (7). Shorten QTc is seen in hypercalcemia, digitalis toxicity and congenital disorders including short QT syndrome.

From Don't Forget the Bubbles: http://dontforgetthebubbles.com/ecg-central/qt-interval/
Morphology
P Wave - Atrial hypertrophy can be assessed via examination of the amplitude and duration of the P-wave. This is usually performed using lead II. Normal p-wave amplitude is <3mm while normal p-wave duration is <0.09s in children and <0.07s in infants. Tall p-waves (>3 mm) represent possible right atrial enlargement (referred to as P pulmonale). This is seen in any condition causing right atrial volume overload including atrial septal defects, Ebstein’s anomaly, or following Fontan corrective procedures. P-waves with duration greater than normal values represent left atrial enlargement (P mitrale). Bifid p-waves in lead II and biphasic p-waves in lead V1 are also commonly seen. Left atrial enlargement is seen in cases of mitral valve disorders and coarctation of the aorta.

QRS Complex - Changes in the QRS amplitude, axis, R/S ratio and/or the T wave can represent ventricular hypertrophy. Specific criteria for right ventricular hypertrophy (RVH) and left ventricular hypertrophy (LVH) exist and are difficult to commit to memory. Again, one should reference standardized tables when evaluating for ventricular hypertrophy such as the one below. (8)
Biventricular hypertrophy should be considered if any of the below are present:
- Criteria for both RVH and LVH are met
- Criteria for either RVH or LVH are met with relatively large voltages in the other ventricle
- Large equiphasic QRS complexes in two or more limb leads and the mid-precordial leads (V2-V5).
Q-wave - The depolarization of the interventricular septum can be assessed using the Q-wave. Though often concerning in the adult world, Q-waves are normal in the inferior and left precordial leads for children up to teenage years. These are normally narrow (<0.03s) and shallow (<5mm deep). Findings causing concern include Q-waves in the right precordial leads or absence of Q-waves in the left precordial leads. (10)
T wave - Ventricular repolarization is represented in the T-wave. While T-waves are a significant source of information in the adult population, they are often of limited value in the pediatric population due to their non-specificity. During the first week of life, T-waves are typically upright in most leads. After this time, the “juvenile T-wave pattern” of inverted T-waves in the anterior leads (V1-V3) emerges. Continued positive T-waves after the first week of life could be a sign of RVH as mentioned above. The “juvenile T-wave pattern” usually corrects between the ages 8-16, however these may persist into adulthood as a normal variant. (10) Flat or peaked T-waves warrant similar workup as when seen in the adult world with the caveat that flat T-waves are normal in newborns.
References
- Mowery B, Suddaby EC: ECG Interpretation: what is different in children? Pediatr Nurs 27: 224, 2001
- Tintinalli JE, et al. Tintinalli’s Emergency Medicine. 8th ed. New York: McGraw-Hill; 2015. Table 127-6, Normal Pediatric Heart Rates
- Tintinalli JE, et al. Tintinalli’s Emergency Medicine. 8th ed. New York: McGraw-Hill; 2015. 127-7, Age-Specific QRS Axis
- Tintinalli JE, et al. Tintinalli’s Emergency Medicine. 8th ed. New York: McGraw-Hill; 2015. 127-8, Age-Specific ECG Intervals
- Rijnbeek, PR, Witsenburg, M, Schrama, E, et al: New normal limits for the paediatric electrocardiogram. Eur Heart J 22: 702, 2001. [PMID: 11286528]
- Bazett HC. An analysis of the time-relations of electro- cardiograms. Heart. 1920
- QT Interval. DontForgettheBubbles.com, Published April 3, 2014. Accessed June 3, 2017.
- Tintinalli JE, et al. Tintinalli’s Emergency Medicine. 8th ed. New York: McGraw-Hill; 2015. 127-9, Voltage Criteria for Left and Right Hypertrophy by Age
- Pediatric Ventricular Hypertrophy. LifeInTheFastlane.com, Updated April 2017, Accessed May 28, 2017.
- Dickinson, DF. The Normal ECG in Childhood and Adolescence. Heart. Dec 2005; 91(12)
Written by Jason Nagle, MD
Edited and Posted by Jeffery Hill, MD MEd


